Intro to Vibe Coding
What is vibe-coding? How do you build something from scratch with no programming knowledge? These are the questions this intro answers.

his is an Intro to Vibe Coding, from my live workshop before the LFG Hackathon I helped host in Manchester. The goal is to build software for public-good, in any way, shape or form - led by experts in their field - not necessarily programmers!
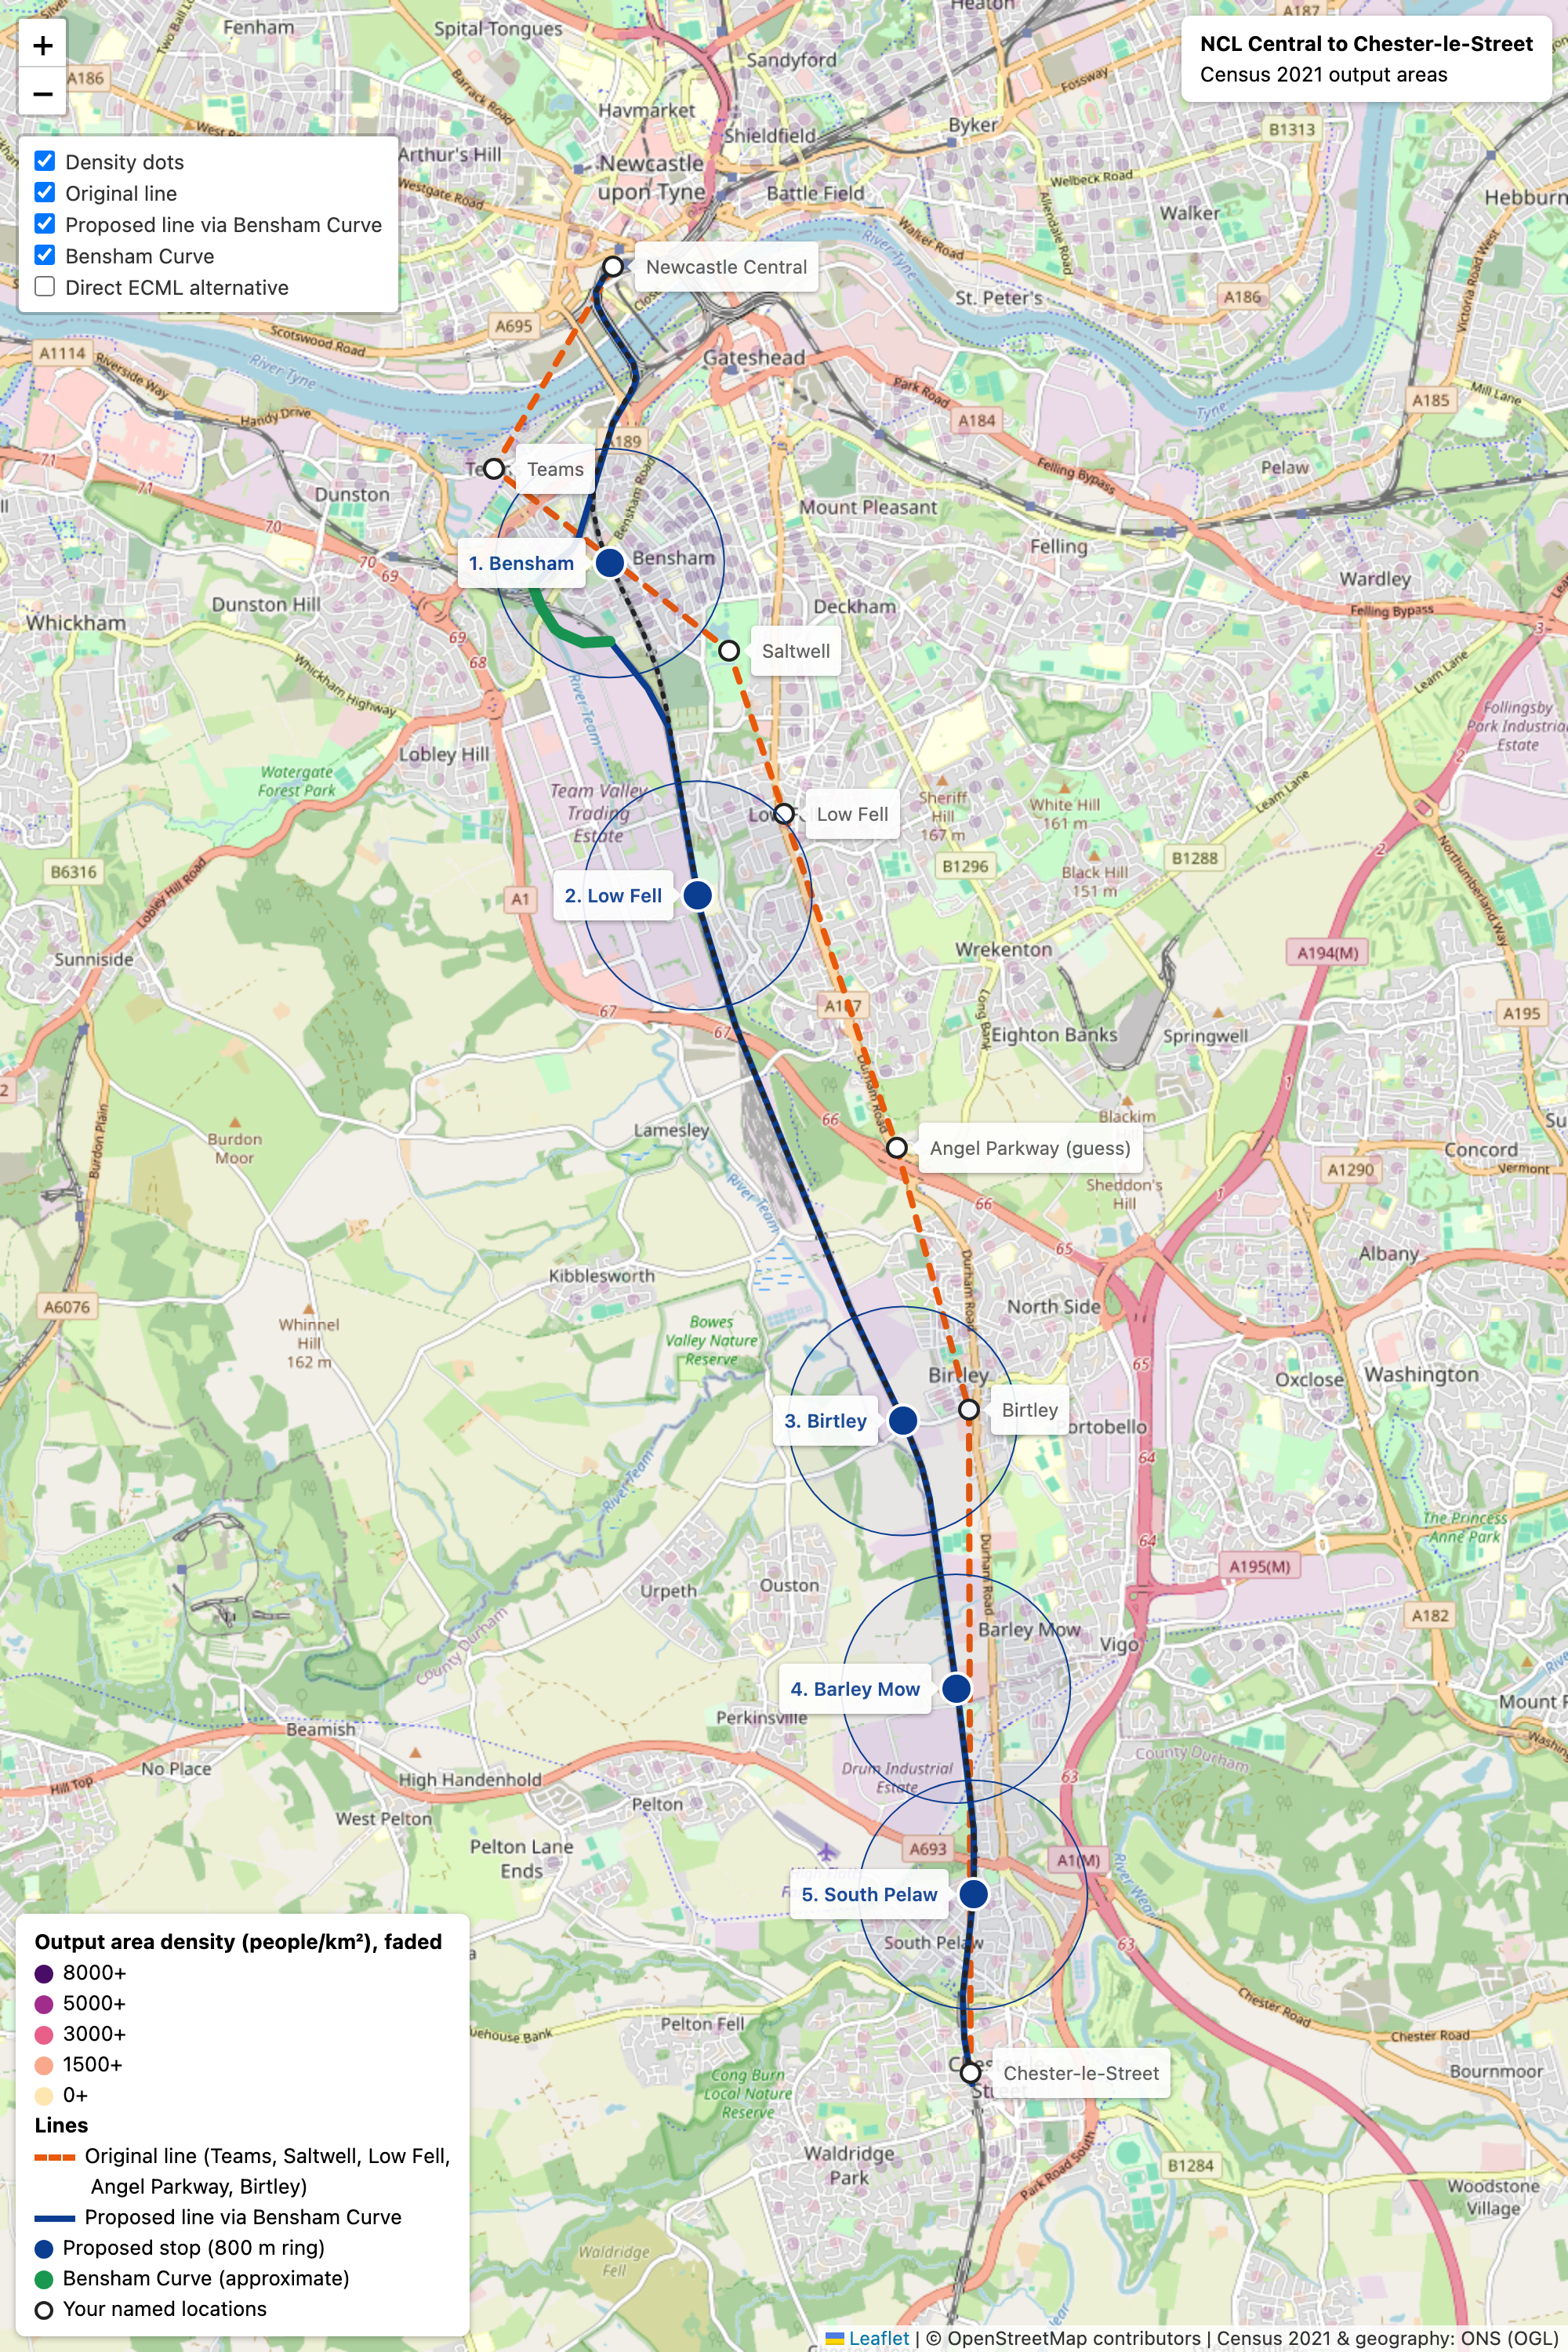
Someone on the video call has just come out of a meeting about transport in Newcastle. They want a rail line from Newcastle Central through the Team Valley industrial estate, one of the largest in Europe, down to Chester-le-Street. There's no train access to Team Valley today. Part of the proposal reuses a disused railway, including a short stretch called the Bensham Curve that could connect via a hub at Newcastle Central. The old line had evenly spaced stations, but nobody knows whether those positions still match where people actually live.
The tool is Claude's Code tab, which can run code directly on your machine. The model is Sonnet, on the $20/month plan. "Hopefully we don't need anything too fancy."
1. Verify the problem
Before you open any AI tool, make sure the problem is real and that you can say exactly what you want to find out. The best problems come from people who live with them.
This one came straight out of a meeting about Newcastle transport, from people already pushing for the line, so the question was real before anyone touched a laptop. Once you're sure of yours, write it down. I opened a code editor, created a folder, and wrote the problem in a markdown file (markdown is just a plain text format; a .txt works too). This gives the AI context it can refer back to later, rather than everything living in the chat window.
2. Research the data
Search for a public source in plain English, download it into your project folder, then cut it down to what you actually need. Google's AI Mode is good for the first part: describe what you need and let it point you to a source.
I searched for "an open official data source, population by town, North East of England." Google pointed to the 2021 Census, and I downloaded the file into the same folder.
Don't paste a big file like this into the chat. The census file was around 20-30 MB of text, so I asked Claude to create a subset of just the North East rows. While it worked, I opened the data myself and found a region column with "North East" as a value. The subset came out at 12 KB. Smaller files mean faster processing and use less of the model's context window (its limited working memory), so you get better answers. Structured data like CSV (comma-separated values) or Excel works well because the AI can write code to pull out relevant rows instead of loading everything into memory.
Your first source probably won't have everything, so ask the AI to find the missing pieces from an API (a way for programs to request data from another service) or somewhere else online. The subset had no location data, so I asked Claude whether it could get coordinates. It found that the ONS Open Geography portal publishes the same built-up areas, keyed by the same codes as the census, free and with no login, and added latitude and longitude columns on its own. I checked the output and noticed the longitudes were negative, then worked out why: Greenwich is 0° longitude, and Newcastle sits west of it. The numbers were correct. Worth checking, though, because the model sounds confident whether it's right or wrong.
3. Build something you can see
Once the data is ready, ask the AI to turn it into something you can look at, like a map or a chart. You don't need to understand the tool it builds with: find one, paste the link, and ask.
I used OpenFreeMap, a free map library I'd used on a side project (a live map of UK trains built from National Rail's data). I pasted the link to Claude and my prompt was literally "yes, build the map." I guess this is true vibe coding. Claude plotted the towns.
The person who understands the problem will know things no public source contains, so add that in too, in whatever form it already exists. The attendee sent a picture of their candidate station list, including a park and ride where the A1 meets the old railway line. I copied the names straight out of the image into Claude and it plotted those as well. Seeing it all drawn out shows you straight away what's there and what's missing, which a spreadsheet won't.
4. Push for answers
So far the AI has only drawn what you gave it. Now ask the question you came with. One attendee put it well: vibe coding is still limited by your data and how you frame the problem. A specific question like "how many people live more than 3 km from a station" will get you further than a vague one like "where should the stations go."
I asked for population density at the suburb level, hoping Claude could suggest ideal stops between Newcastle Central and Chester-le-Street. In parallel I asked Google the same question, which pointed at electoral-ward-level data. Running your own searches alongside the AI is worth the effort: humans are still faster at single lookups, and LLMs win when there's a lot of data to process. I ran Google searches myself the whole session while Claude worked in the background. Claude had meanwhile found population clusters on its own, drawn something that looked like an electoral map, and suggested where the stops should go.
"Flipping heck. That's so cool," said one of the group.
5. Say what looks wrong
Read the output at every step, and when something looks wrong, tell the AI what's wrong in plain words. You don't have to fix the code yourself.
I asked Claude to show the old line and the new suggested line side by side. It didn't know the real track path, so at one point it tried to bridge the line straight over the river. I described the Bensham Curve to it by name and it tried again. Half the time I couldn't tell where it had found its data. "That's why we call it vibe coding, because you're vibing it."
The negative longitudes and the line over the river were both moments where reading the result caught a problem or confirmed a detail.
Your turn
The whole session ran under an hour, questions and tangents included. Claude works a lot like ChatGPT, so if you've used that, the interface won't feel alien. Google also has an AI coding tool called Antigravity that comes with a Google AI subscription. For small personal projects they're all roughly the same right now. If you want to compare models, Artificial Analysis (artificialanalysis.ai) plots intelligence against cost per task, which matters when you pay per token. Crowdsourced leaderboards like Arena are useful but don't show cost.
Pick a local problem you already care about, download a public dataset, and describe what you want in plain English. The model understands you even when you use fewer words, so don't overthink the prompt. If something goes wrong, describe what went wrong and it will try again.
Most of the people on that call weren't programmers, and by the end one of them was talking about taking the map to Gateshead Council. A question you care about and the habit of checking the answer will get you a long way.
The full transcript of the session is below if you want to follow along step by step.